Charts
We specialize in mechanical impact recorders to monitor any and all types of transportation modes.
Chart and Chart Speed
| RM-3WE CHART INFORMATION | ||
| MODEL NO. | CHART SPEED | CHART TYPE |
| RM-3WE 7 DAY | 6” Per Hour | RM-90 6” – 3” |
| RM-3WE 14 DAY | 3” Per Hour | RM-90 6” - 3” |
| RM-3WE 30 DAY | 1 ½” Per Hour | RM-90 ¾” – 1 ½” |
| RM-3WE 60 DAY | ¾” Per Hour | RM-90 ¾” – 1 ½” |
| RM-3WE 90 DAY | 3/8” Per Hour | RM-90 3/8” |
| RM-3WE 120 DAY | 3/8” Per Hour | RM-90 3/8” |
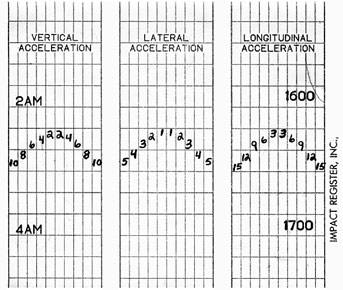
The right is a sample piece of a chart. It assumes a chart speed of ¾” per hour and a G range of plus or minus 10G vertical, plus or minus 5G lateral, plus or minus 15G longitudinal.
The above graph indicates how to read the resultant impacts which occurred. Please note that each axis block is divided into ten equal sections, five on each side of the center line. These five spaces are very important. Assuming the vertical axis is set for a maximum of plus or minus 10G, each space on the vertical axis equals 2G. If the lateral axis is set for plus or minus 5G, each space equals 1G. The longitudinal axis set at plus or minus 15G will result in each space equaling 3G.
Do not read the full swing of the stylus for each shock incurred, only read the maximum deflection from the CENTER LINE on the shocks that are recorded.
| GEMM CHART INFORMATION | ||
| MODEL NO. | CHART SPEED | CHART TYPE |
| GEMM – 14E | 1” Per Hour | GEMM-34 1”– ½” |
| GEMM – 33E | ½” Per Hour | GEMM-34 1”- ½” |
| GEMM – 60E | ¼” Per Hour | GEMM-34 ¼” |
| GEMM – 90E | .167” Per Hour | GEMM-34 ¼” |
| GEMM – 120E | 1/8” Per Hour | GEMM-34 ¼” |
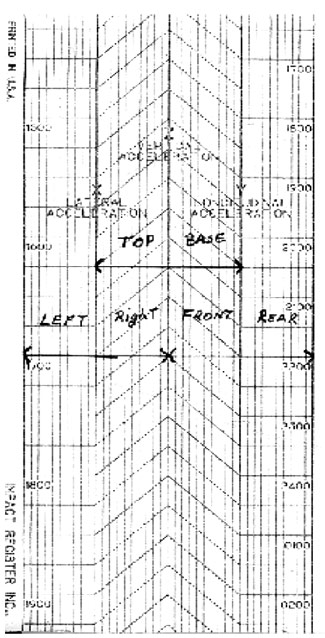
Note that there is a 3” of recording trace on 2” of chart. This is accomplished by placing the vertical record exactly ½ “ in front of the lateral and longitudinal record.
The wording on the chart “Base and Top”, “Left and Right”, and “Front and Rear” indicates how the GEMM will record when a shock is incurred. It is assumed that the GEMM has been placed in a package, for example, if the package (GEMM) was dropped on its front, the trace would be longer on the left side of the Y axis. If the package (GEMM) was dropped on its base, the trace would be larger on the right side of the Z axis.
If the GEMM has a maximum G sensitivity setting of ±100G on each axis, each ½” of chart equals 100G, therefore, 100G of each direction on each axis. For a 100G instrument each space equals 10G.
For a maximum G sensitivity setting of ± 50G, ½” of the chart equals 50G and each space on the chart for each axis equals 5G.
To determine what G’s are incurred, regardless of the maximum sensitivity setting of a particular GEMM, divide the maximum setting by 10 (the number of spaces for each direction). On a ± minus 25G GEMM, each space on the chart equals 2.5G (25 ÷ 10). The heavy lines across the chart are ¼” apart. On the right side of the last 5’ of the chart there is a red line which serves as warning that you are nearing the end of the chart.
All records are made on wax coated charts by stainless steel stylus points that remove wax from the chart.
WARNING
The copyrighted recording charts sold by Impact Register Inc. are made to stringent specifications that guarantee the recording accuracy of the device.
The use of any other chart in these recorders voids the accuracy and warranty of the recorders. Furthermore, the use of any other chart in these recorders is not recognized in litigation where chart records are used as evidence.